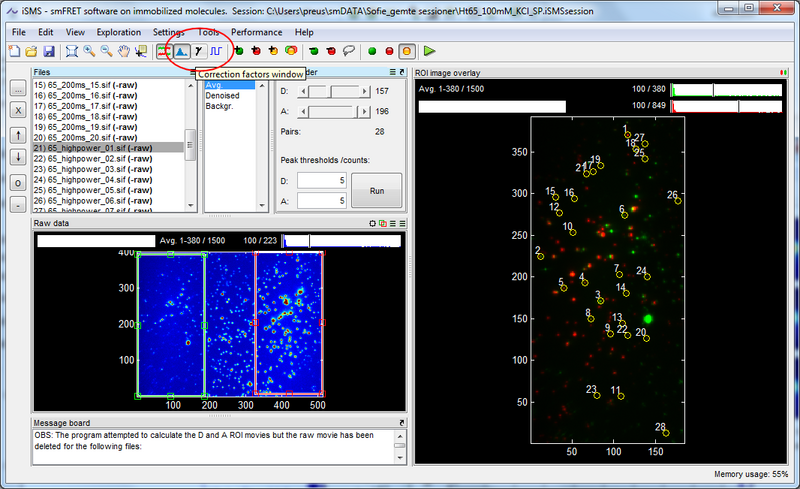
Open the correction factor window in the toolbar of the main window.
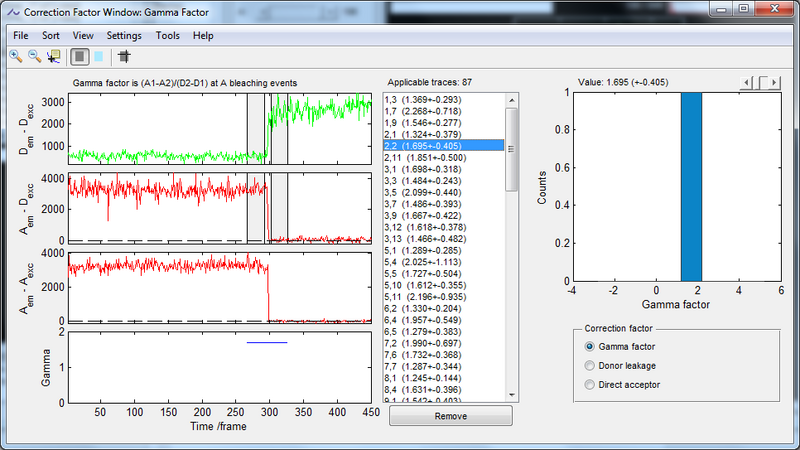
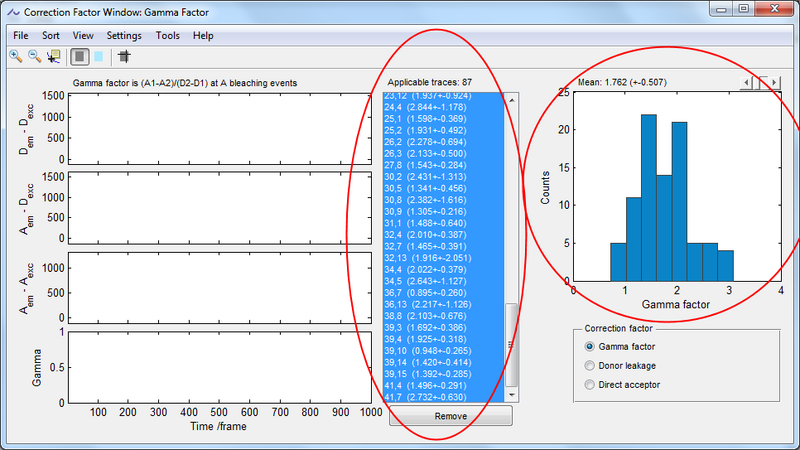
The correction factor window automatically calculates correction factors of molecules showing bleaching. Select the correction factor of choice in the lower right panel. The listbox lists all molecules applicable for calculating the selected correction factor and shows the value of the correction factor of each molecule along with its standard deviation. The traces to the left highlights the time-intervals used for calculating the correction factor of the selected molecule.
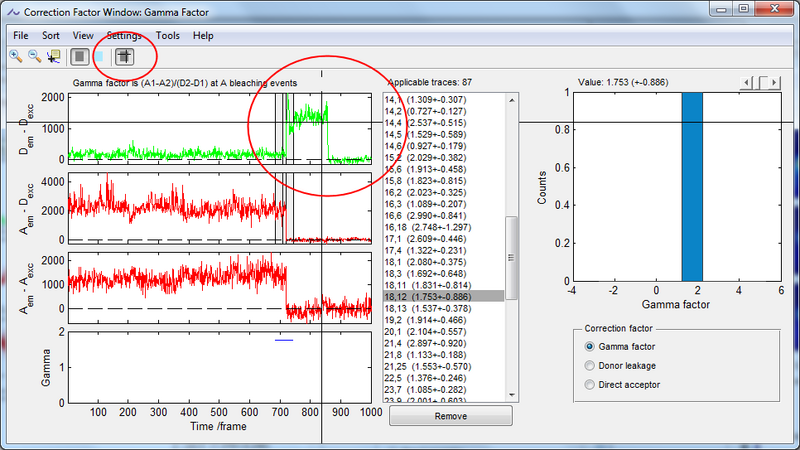
If the default intervals used for calculating the correction factor are not optimal set the intervals manually: Select 'Set time-interval...' in the toolbar. Move the crosshair to the interval of the trace. Select the new interval of interest by pressing left mouse button twice within the trace, which defines the new interval.
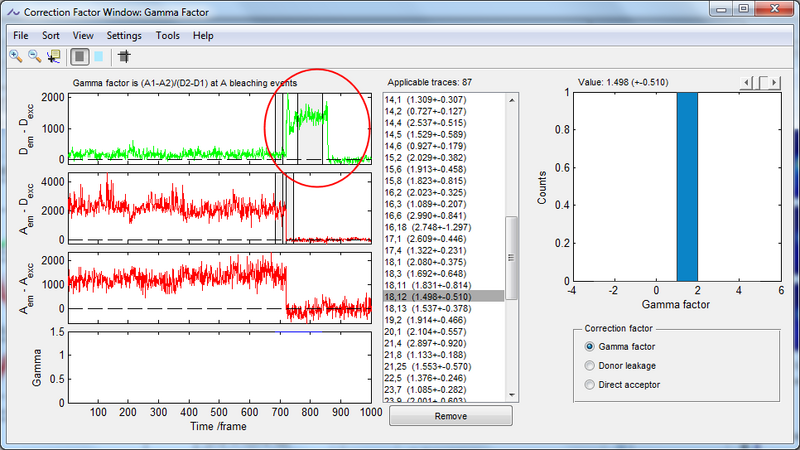
The new interval is shown in the plot and the correction factor of the selected molecule is automatically updated according to the new interval.
To determine a global correction factor value and a histogram of all molecules select multiple molecules in the listbox. The histogram to the right is automatically updated according to the selection and shows the global correction factor value above the plot. Use the slider to set bin size.
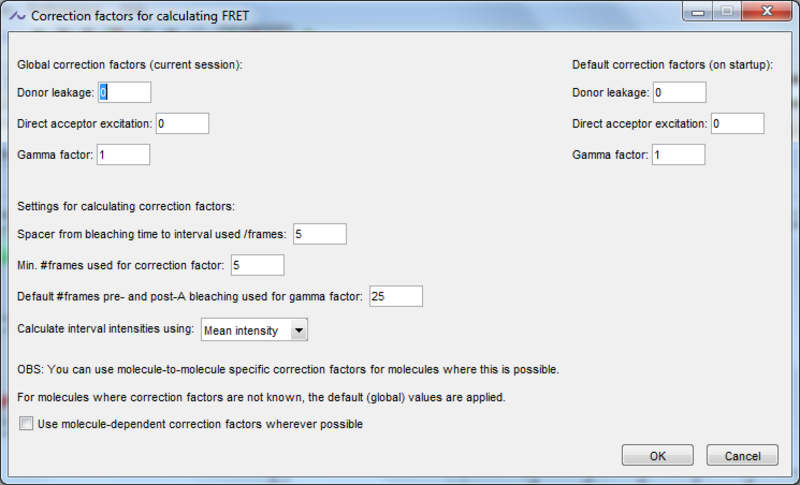
The default settings for calculating correction factors are set in 'Settings->Correction factor settings'.